Making Data Sexy is my brainchild.
Who am I, you ask?
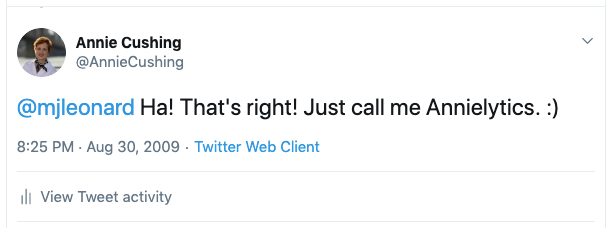
My name is Annie Cushing, and I blog mostly about web analytics and marketing data at Annielytics.com. Like many legitimate brands today, it started as a joke on Twitter.

Go a lil easy on me with the sideways smiley. The only emoji we had in 2009 was a psychotic little paperclip that asked too many questions.
Quick Aside: You can follow me on Twitter or Facebook. I share mostly marketing news.
Back Story
It all started in 2010 with a pretty shattering near failure.
I had taken an analytics certification course that required students to build a dashboard as their final project. Did the course teach us how to create dashboards? No. Did we even crack Excel open throughout the course? Nope. Was it listed as a prerequisite for the course? Nein. We were just supposed to know how to do it.
Well, yours truly could barely create a line chart. So, after a plethora of Google searches, I pulled together a dashboard only a mother could love. But I was proud of it. It was the kind of pride a toddler experiences when she discovers that by removing all the plastic storage containers and lids from the perfect toddler-size kitchen cabinet, she can one up her opponent in a heated game of hide and seek. (Based on a true story. *cough* Victoria *cough*)
Fast forward to the day of my “dissertation”…I was mid-presentation with my primitive dashboard, and the instructor asked me why I didn’t combine two metrics in the same chart. I didn’t because I had no idea how to create a combination chart. I didn’t even know what a combination chart was at that time. The instructor replied, “If you pass….” I honestly have no idea what he said after that. It was straight up right out of Peanuts. Everything faded to black. I was a single mother and put $3,500 on a credit card to pay for this course. Failure wasn’t an option.
When I received the email letting me know I had passed the course a few days later, I never opened the file with the feedback. I just hit archive and have still, to this day, never opened the file. I took the weekend to lick my wounds and rue the day I signed up for that course. But a couple weeks later I decided to leverage my rage to learn Excel so that it would never embarrass me again like that.
Just one problem: Time. It was was a luxury I didn’t have. So I looked at my schedule and habits to see if there was anything that could go. And I decided running had to go. I hung up my running shoes and bought a gym membership so that I could (no joke) read Excel books while working out. I did this for more than two years.
Sometimes a terribly misguided dude would sidle up to me on a neighboring elliptical to strike up conversation, thinking that he was rescuing me from my boorish reading. In reality, these interventions were huge distractions.
I believed I could. And I did. Annnnd I’m still single. But I’m sure these facts are loosely correlated at best.
An Obsession Was Born
Month after month I read Excel books hand over fist. And I got really good at reading while working out on the elliptical, arc, and stair stepper. We won’t talk about my attempts at running on the treadmill while reading and flipping pages.
Anyway, back to learning Excel….
I had two primary issues with the books I was reading:
- The examples were almost exclusively taken from financial data. As a marketer, I rarely deal with principle and interest.
- The visualizations were lackluster. Although I was a neophyte when it came to data visualization, I knew from my experience working with designers in an editorial role that the charts were poorly designed because my eyes had no resting place. They darted to and fro with no clear landing strip or central focal point.
So I set out to see if I could apply the design principles I learned working with top-shelf designers with my growing passion for all things data and all of these financial applications to marketing data.
With Making Data Sexy, I made the data used in the visualizations was industry agnostic by using datasets from many different sectors: financial, marketing, education, government, etc. It is essentially my attempt to compile the resource that would have served my needs if I had read only one book.